Physical Properties of Test Coral Sands
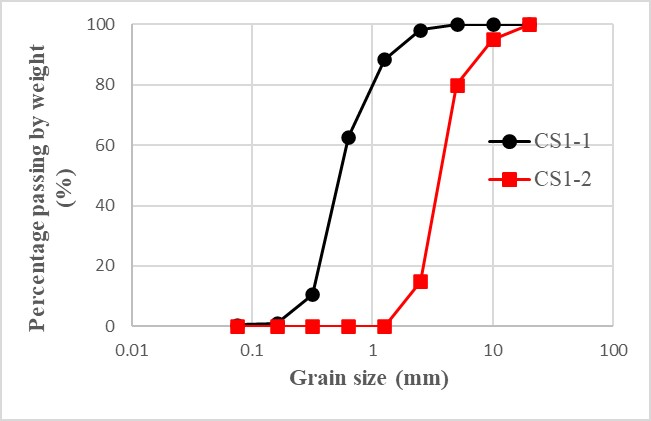
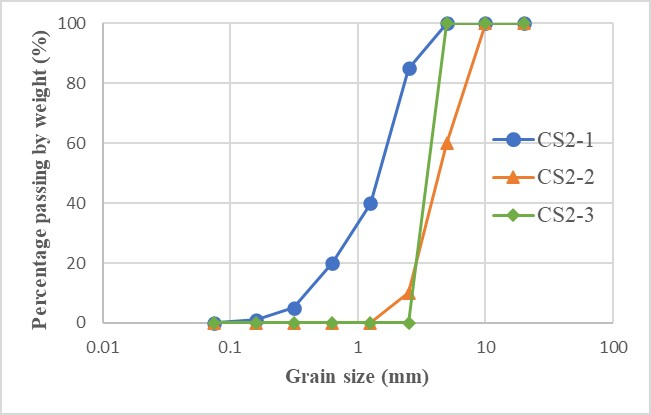
Five different grain size distributions were selected for the tests,tests, and they were divided into two groups.
- Group No. 1: CS1-1 and CS1-2
- Group No. 2: CS2-1, CS2-2 and CS2-3
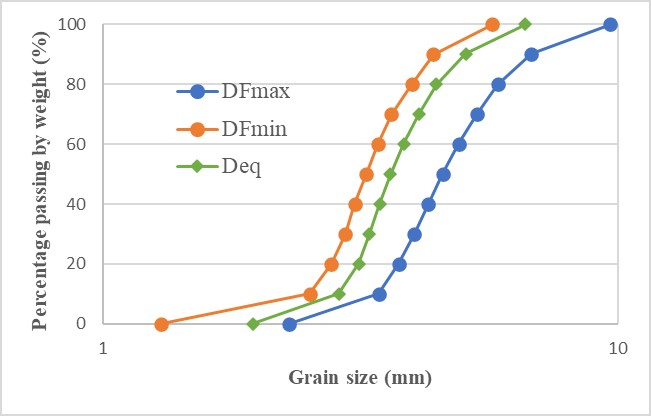
1. Particle size distributions obtained from sieve analysis
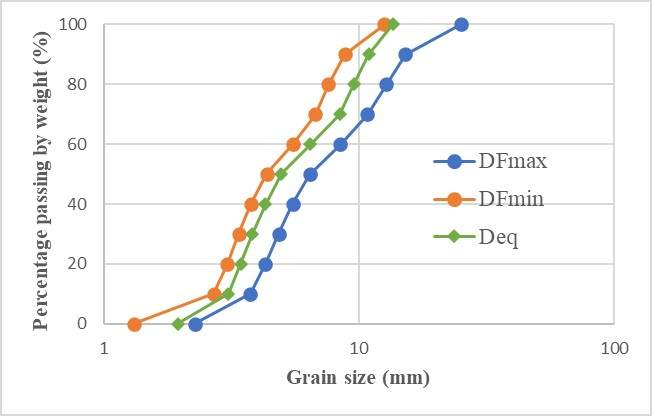
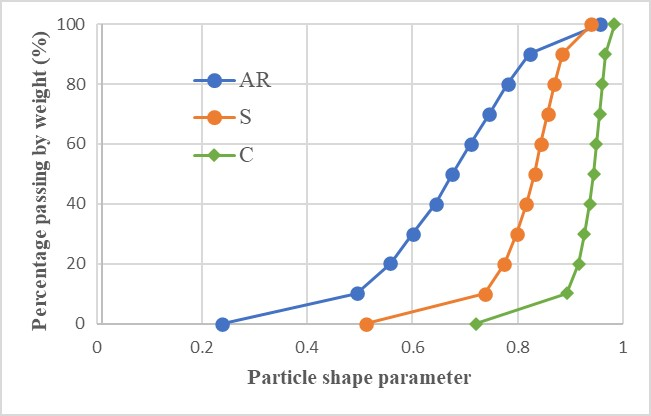
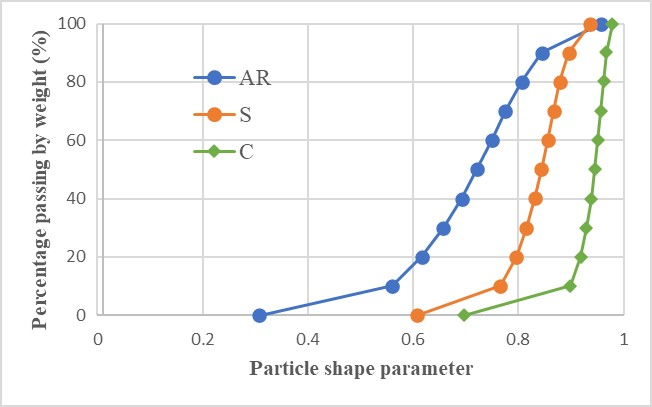
2. Particle size and shape distributions obtained from 2D image analysis
Notation:
- \(D_{Fmax}\): Feret diameter-Max
- \(AR\): Aspect ratio;
- \(D_{Fmin}\): Feret diameter-Min
- \(S\): Sphericity;
- \(D_{eq}\): Equivalent diameter
- \(C\): Convexity
2.1. CS2-2
2.2. CS2-3
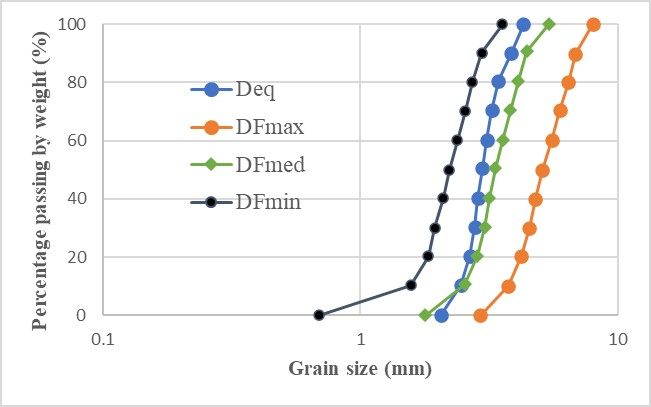
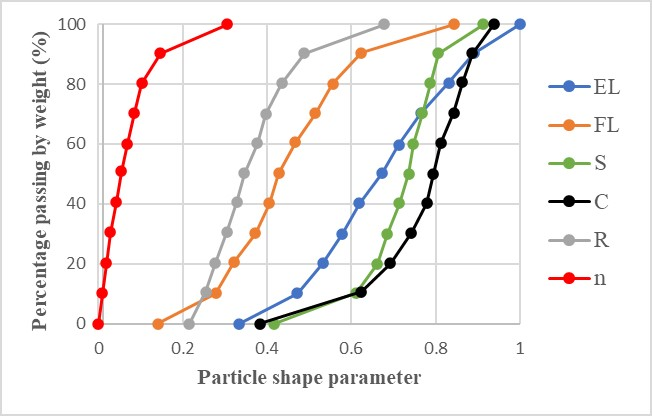
3. Particle size and shape distributions obtained from 3D X-ray micro-computed tomography (μCT)
Notation:
- \(D_{Fmax}\): Feret diameter-Max
- \(EL\): Elongation
- \(R\): Roundness
- \(D_{Fmed}\): Feret diameter-Med
- \(FL\): Flatness
- \(n\): Intra-particle porosity
- \(D_{Fmin}\): Feret Diameter-Min
- \(S\): Sphericity
- \(D_{eq}\): Equivalent Diameter
- \(C\): Convexity
3.1. CS2-3
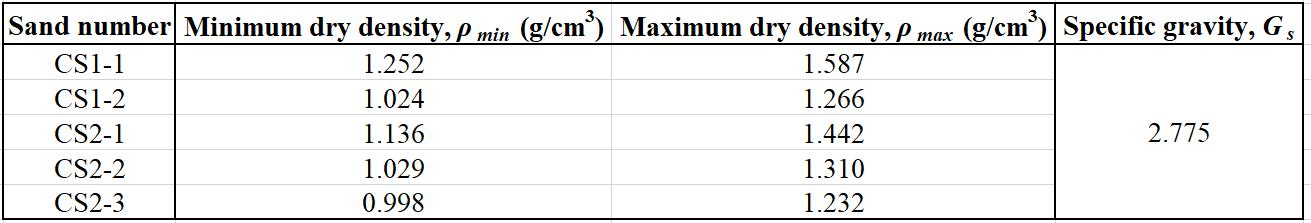
4. Minimum and maximum dry density, and specific gravity